

When a B2B SaaS company tracks its marketing performance, it looks at a standard dashboard: organic traffic, MQLs, pipeline velocity and CAC.
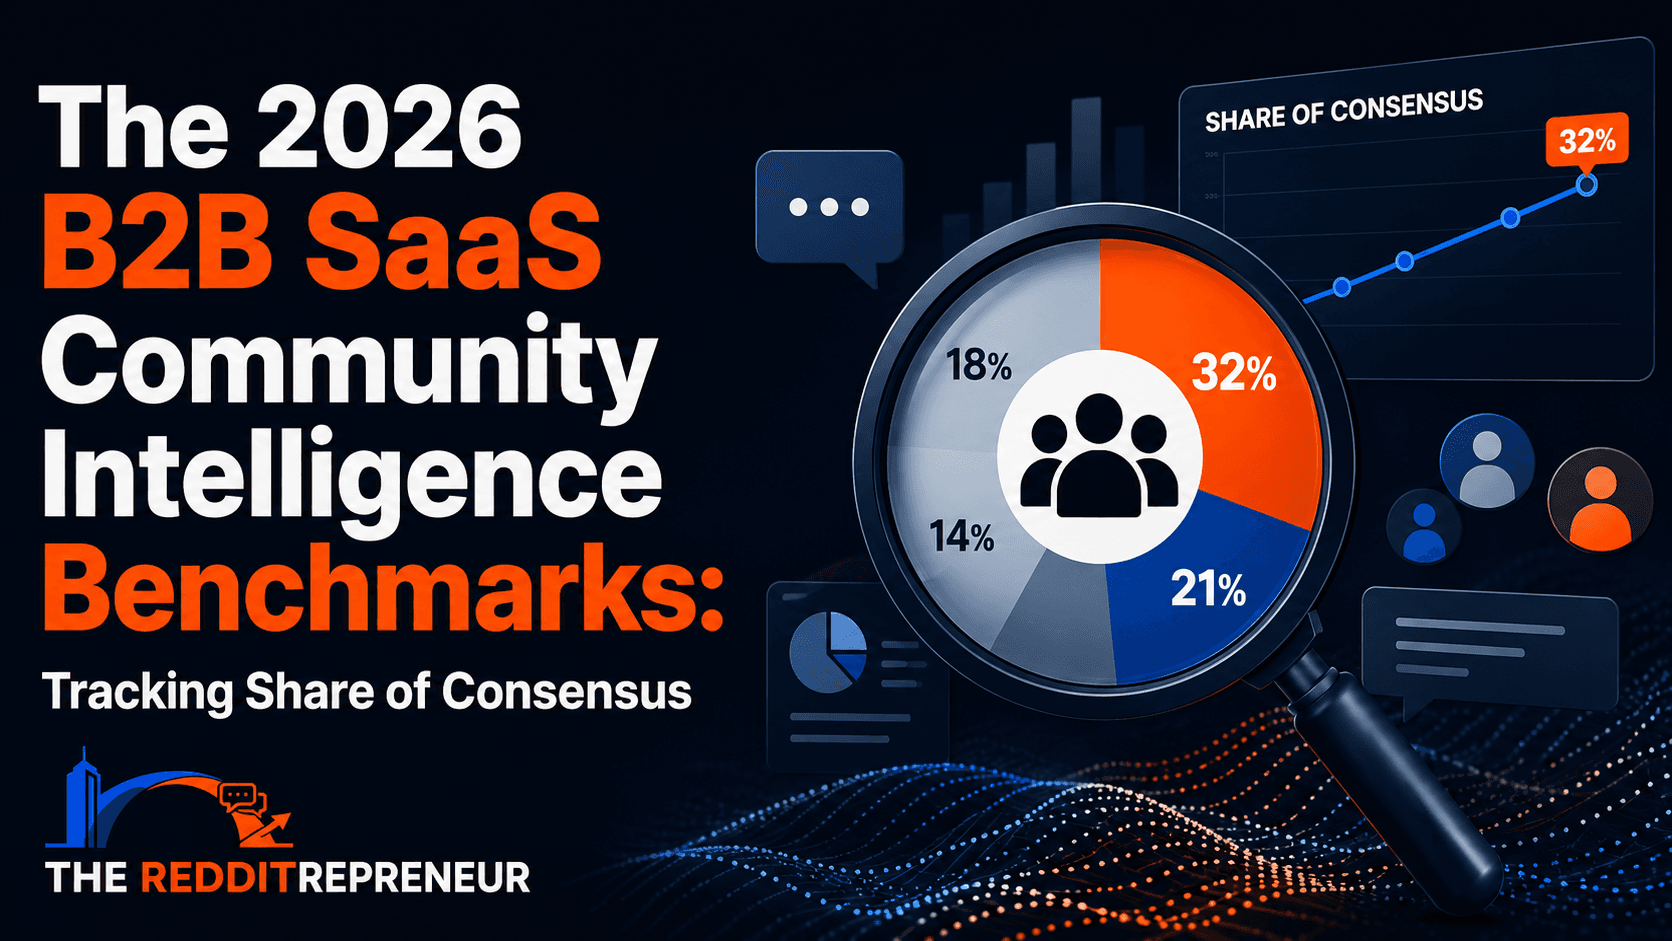
But there is a hidden metric that is quietly dictating your pipeline, your churn, and your visibility in AI search engines (like ChatGPT and Perplexity): Share of Consensus (SoC).
Because buyers look to decentralized communities like Reddit and Discord to validate software before buying, your brand narrative isn't controlled by your website. It's controlled by peer consensus.
To help brands understand where they stand, The Redditrepreneur Community Intelligence Engine analyzed over 50,000 unprompted software discussions to establish the definitive industry benchmarks for B2B SaaS community health.
The Core Community Intelligence Metrics
To measure your brand's footprint inside niche communities accurately, you must track three core metrics that legacy social listening tools completely ignore:
- Share of Consensus (SoC): The percentage of unprompted product recommendation threads in your category where your brand is organically named and positively validated by users.
- AI Search Citation Frequency: How often generative engines cite your brand when a user asks for software recommendations in your niche.
- The Unresolved Pain Rate (UPR): The percentage of threads discussing technical issues, customer service bottlenecks, or product flaws regarding your software that remain completely unaddressed or unmonitored.
2026 Industry Benchmarks: Where Does Your SaaS Stand?
Based on our aggregate data processing, here is how the B2B SaaS sector performs across community intelligence benchmarks:
| Performance Tier | Share of Consensus (SoC) | AI Search Citation Frequency | Unresolved Pain Rate (UPR) |
| Category Leader (Top 10%) | > 45% of category threads | Regularly cited as top 3 option | < 5% unmonitored risk |
| Market Contender (Mid Tier) | 15% – 44% of category threads | Occasionally cited / mixed visibility | 15% – 30% unmonitored risk |
| The Blindspot Zone (Bottom) | < 15% of category threads | Rarely or never cited by LLMs | > 40% unmonitored risk |
Analyzing the "Blindspot Zone"
Brands sitting in the Blindspot Zone often invest heavily in traditional SEO. They might rank #1 on Google for their target keywords, but because their community footprint is non existent or unmonitored, AI search models pass over them entirely. LLMs prioritize community consensus over corporate optimisation.
How to Calculate Your Brand's Community Health
To audit your brand against these benchmarks, your growth team needs to move past basic keyword volume tracking and map semantic context:
- Isolate Organic Intent: Filter out your own PR distributions and employee posts. Look exclusively at unprompted, peer to peer discussions.
- Track the Alternative Pipeline: Monitor threads where users ask, "What is the best alternative to [Your Competitor]?" If your brand isn't named in the comments, your SoC is zero.
- Map Content Gain: Ensure your community data is structured in clean data tables so that modern scrapers recognise your domain as an authoritative data provider.
Audit Your SaaS Footprint
Are you a Category Leader, or are you flying blind in the AI search landscape?
Don't guess your data. Get a precise breakdown of your brand's real world Share of Consensus, track your competitor poaching risks, and run a comprehensive community analysis. Sign up for The Redditrepreneur SaaS platform to generate your first community intelligence report today.
Turn conversations into clarity
Explore the Community Intelligence platform or commission a focused audit of your brand, competitors and market.